
PMI Certified Professional in Managing AI (PMI-CPMAI)™ Certification
The PMI-CPMAI™ (Certified Professional in Managing AI) Certification is a s...
Data Visualization Using Tableau is a comprehensive, hands-on training program designed to help learners transform raw data into meaningful insights through interactive dashboards, reports, and visual analytics. The course covers Tableau fundamentals, data preparation, data model...
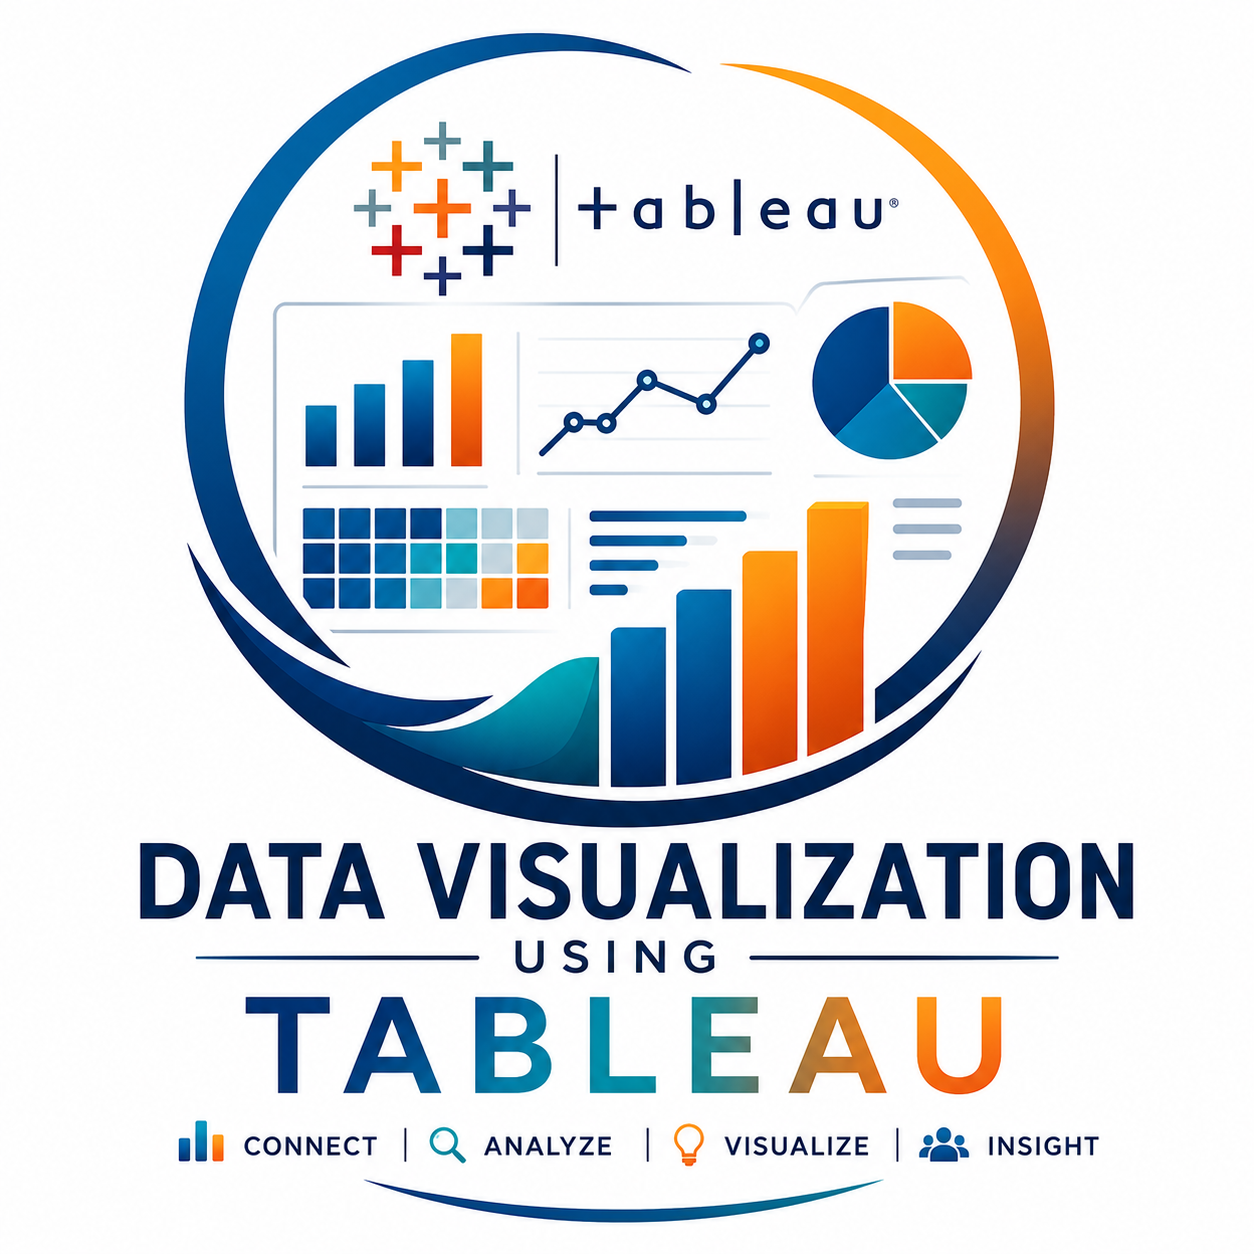
Data Visualization Using Tableau is a comprehensive, hands-on training program designed to help learners transform raw data into meaningful insights through interactive dashboards, reports, and visual analytics. The course covers Tableau fundamentals, data preparation, data modeling, chart creation, dashboard development, storytelling with data, and advanced visualization techniques. Participants will learn how to connect multiple data sources, create dynamic visualizations, build business intelligence dashboards, and generate actionable insights that support data-driven decision-making. This course is ideal for professionals seeking to develop practical data visualization and business intelligence skills using one of the world's leading analytics platforms
Tableau is a leading Business Intelligence and Data Visualization platform used to analyze data and create interactive dashboards and reports.
No. Tableau is primarily a drag-and-drop visualization tool and does not require programming knowledge for most tasks.
You will learn data visualization, dashboard development, data analysis, business reporting, data storytelling, and interactive dashboard creation.
Yes. The course starts with Tableau fundamentals and gradually progresses to advanced visualization and dashboard development techniques.
Tableau is widely used in Finance, Healthcare, Retail, Marketing, IT, Manufacturing, Logistics, Banking, and Consulting industries.
Yes. The course includes practical assignments, dashboard-building exercises, and a capstone project.
You can pursue roles such as Data Analyst, Business Analyst, BI Analyst, Reporting Analyst, MIS Executive, and Data Visualization Specialist.
Yes. Tableau can connect to Excel, SQL databases, cloud platforms, CSV files, Google Sheets, and many other data sources.
Yes. Tableau remains one of the most sought-after business intelligence and data visualization tools globally.
Tableau helps professionals analyze data quickly, create impactful visualizations, support business decisions, and improve career opportunities in data analytics and business intelligence.
The PMI-CPMAI™ (Certified Professional in Managing AI) Certification is a s...
Gen AI Enterprise for Agilists is an advanced, hands-on training program de...